Analyse and compare the performance(s) of your event(s)
1. Select the desired event via 'Manage'.
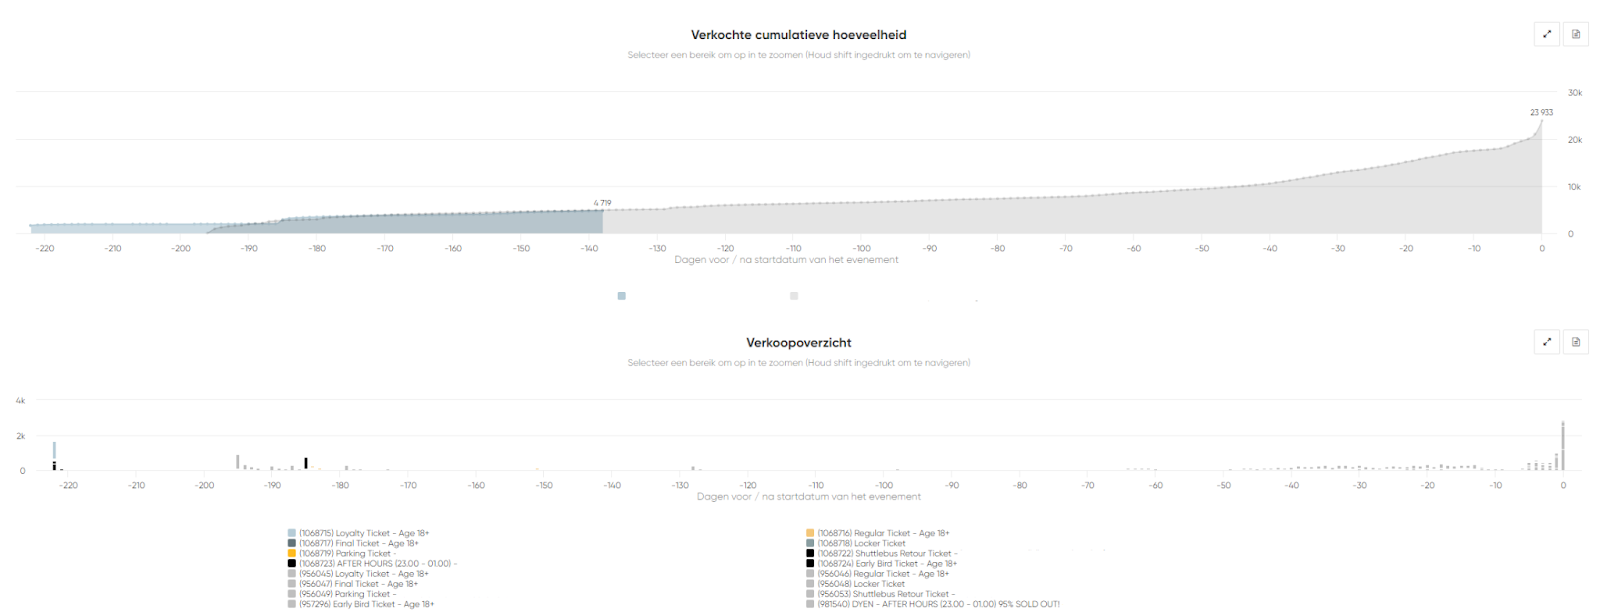
2. Open the Reporting Dashboard, you can also select 'view insights' directly from the dashboard on the event.
3. Select one of several view options:
- General view
- Demographic statistics
- Scan Statistics
You can now start analyzing your event(s) in the Reporting Dashboard. You can do this by working with different filter applications and then export the overview. By adding an additional event to the filters you can compare different events with each other.

You can adjust the filter so that you can compare your events with previous years. This way you can keep track of whether you are on track compared to previous editions. You can set this up by taking the following steps:
- Under filter 'Events', enter the events you want to view.
- At 'Compare Events', enter the event with which you want to compare it.
This will give you an overview of two colors (or more if you entered multiple events to compare) and you can easily compare and see how you stand.
Related Articles
View daily statistics in the event dashboard
Each event has its own dashboard to see the number of tickets sold, revenue generated, and capacities still to be sold at once. To do this, go to the event of your choice via 'Manage', and view the data here in the event dashboard. There are several ...Your secondary sales in a single dashboard
Introduction Are you already using our resale options such as Resale or the Waiting List? Below is a description of how you can easily view the statistics of sales via these channels. Reporting dashboard Via 'events dashboard', click on 'reporting ...Your reservations in one dashboard
Introduction Do you use reservations? Below is how you can easily view the statistics of requests and completed orders through this channel. Reporting dashboard Via 'events dashboard', click on 'Reports dashboard' and then view: 'Reservation ...The most frequently used reports
In this article you will find an overview of the most frequently used reports with a short explanation and the variables that can be found in the report. You find these reports by clicking on 'Reports' in the top bar and then 'Custom'. In some cases ...Where and how to read the sales dashboard
Would you like to gain insight into your sales in our Backoffice? It is possible to gain insight into sales by product and pool. Click on your desired event. Navigate left in the bar to reports-> Sales dashboard Here you can see all the sales data ...